
Reading Between the Tides
200 Years of Measuring Global Sea Level
by Amy Dusto
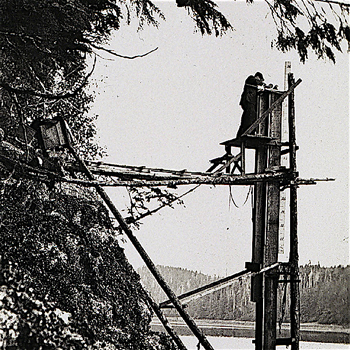
Checking the automatic tide gauge at Port Protection, Prince of Wales Island, Alaska, 1915. Photo from NOAA Photo Library.
Global warming and the rising sea levels that come with it may bring to mind catastrophic coastline destruction during storms and mass relocation to higher grounds—or at the very least, a good reason to reevaluate beachfront flood insurance policies. But before we can prepare for whatever impacts a more voluminous ocean may have on civilization, we need an accurate measure of just how high the sea level is, and just how fast it’s rising. NOAA’s on that.
Gauging average global sea level is trickier than sticking a ruler in the depths and noting the day-to-day or year-to-year changes. That’s because the ocean doesn’t have one steady level. Tides and currents constantly flow up and down, while tectonic forces move land masses relative to the water, for a few of many factors.
Since scientists first began seeking sea level measures more than 200 years ago, their methods have come a long way. Here’s a look at the technologies climate and marine scientists have used for the job of tracking Earth’s tides and average level, then and now.
The highs and lows of tide gauges
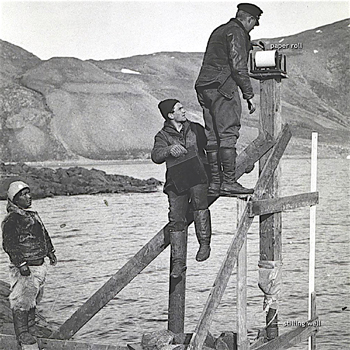
A Coast and Geodetic Survey officer (B. H. Rigg) checking a tide gauge on western Greenland as part of the MacMillan Arctic Expedition in 1926. Original photo from NOAA Photo Library.
In 1807, at Thomas Jefferson’s request, the U.S. government began a systematic survey of the coastline to map the new nation and facilitate maritime commerce. (Even older records exist from a few locations around the world.) Because the coastline changes with the tides, that meant the surveyors also needed to begin measuring changes in the coastal water levels.
At first they used tide staffs, essentially tall wooden rulers that had to be read manually. Many tide staffs were placed in stilling wells, a long metal tube with an open end beneath the water that minimizes the effects of passing waves. An observer noted the water level relative to a fixed point on the land.
It wasn’t until 1851 in San Francisco that the U.S. Coast and Geodetic Survey first deployed a self-recording tide gauge. Invented by Joseph Saxton, the gauge had the same stilling-well setup, but also included a pen resting on a rotating paper drum. The drum used clock springs to keep the paper rotating at a constant rate (to keep track of time), while the pen, attached by a wire-and-pulley system to a float inside the well, moved up and down with the tides. As the pen bobbed with the float, it traced a graph of the changing water level across the paper-covered drum.
“They worked well when they worked,” says Mark Bushnell, an oceanographic consultant at CoastalObsTechServices, LLC, and a former NOAA oceanographer. “The past two directors of NOS/CO-OPS [the National Ocean Service Center for Operational Oceanographic Products and Services] like to quote Alexander Dallas Bache, the second superintendent of the Coast Survey, 1854: ‘It seems a very simple task to make correct tidal observations; but, in all my experience, I have found no observations which require such constant care.’”
The early tide gauges were expensive and difficult to maintain—and if they stopped working, the local tide observer would have to contact Coast Survey field parties by mail to inform them. Then it could be several weeks before repairs were made. Several other types of tide gauges arose in the following decades, each gradually improving on the amount of manual labor required, the cost or the accuracy of the data collection. For one thing, scientists later replaced analog gauges with punched-paper tape systems that computers could read and tabulate.
Microwaves and GPS
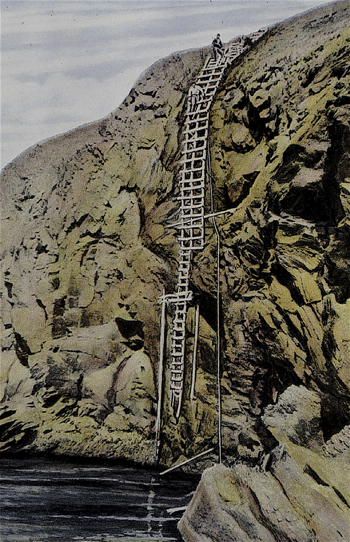
To read the tide gauge at Cape Mordvinof on Unimak Island, Alaska, in 1939, scientists had to descend a 60-foot ladder suspended by wires and stakes. Photo from NOAA Photo Library.
Jumping ahead over the invention of the automobile, DNA’s discovery, and the development of manned spaceflight, the newest sea level measuring tools being deployed today use radar—in the form of microwaves—to measure the distance from a fixed point above the water to its surface. They are often mounted off the ends of piers. “There are no moving parts, nothing in the water to corrode, and they’re impervious to things like water density or air temperature gradients that affect other technologies,” Bushnell says.
NOAA is in roughly the first year of a four-year project to replace most of the sensors in its 210-strong network covering the nation and many U.S. territories with microwave sensors, says Steve Gill, chief scientist at NOS/CO-OPS. Most of the older sensors were installed in the early ‘90s and work similarly, but use sound waves instead of microwaves—and therefore must be enclosed in protective tubes that extend into the water. The microwave sensors, in contrast, can operate without any protection from waves, noise or weather. NOAA will operate both types of sensors side by side for several months before disassembling the old sensors to check for any discrepancies in the data, Gill says.
Compared with the old technologies, the microwave sensors are more reliable and much cheaper to install and maintain—no boats, divers or regular manual attention required. However, the data they provide is only marginally more accurate. In fact, the accuracy of the monthly mean sea level observations—which most climate scientists use as a starting data point when looking at long-term ocean trends—as calculated using measurements from the microwave sensors is almost exactly the same as what scientists calculated using tide gauges in the 1800s, Bushnell says. That’s a testament to the painstaking, detail-obsessed work done by generations of tide gauge observers, technicians taking care of the equipment, and NOAA analysts putting together the results from all the nation’s gauges every month, according to Gill.

A microwave radar attached to a bridge over the Dog River in Alabama. The radar, encased in the white plastic housing in the foreground, sends a pulse of microwave energy down toward the water surface and listens for the echo. The higher the water, the quicker return echo. NOAA photo courtesy Morgan McHugh.
Oceanographers are also developing continuous GPS systems—which relay location information all the time rather than occasionally—to measure sea level while taking into account a factor they hadn’t understood well until recently: the motion of the land. That activity may seem subtle to locals, but it can change the relative distance between the water’s surface and the old benchmark (a fixed reference point on land nearby) significantly in just a few years. Scientists have been correcting tide gauge records for that movement using statistical models of the Earth’s movement for decades, but continuous GPS will provide a more accurate estimate of local vertical land motion so that absolute sea level change can be better estimated from tide gauge records.
“The next big thing will be a GPS mounted directly on the microwave sensor, reducing and eventually eliminating the need for benchmarks [on land],” Bushnell says. Scientists are also developing GPS buoys that can measure sea levels offshore, potentially covering more of the oceans than coastlines, Gill adds. Since 1993, satellite altimeter missions have been providing highly accurate sea level measurements far out at sea, too, though their paths don’t cover polar areas, he says.
What our tools are telling us
Taking information from both tidal records and satellites into consideration, a report from the Intergovernmental Panel on Climate Change concluded that sea level rose around 0.07 inches (1.7 millimeters) per year between 1901 and 2010 and that between 1993 and 2010, the rate was very likely higher, more like 0.13 inches (3.2 mm) per year.
Gill says we have to be careful about how much of the recent decades’ acceleration we attribute to global warming and how much to natural variability. The acceleration could be coming from more rapid melting of ice sheets or increasing ocean heat content, but two decades is also within the time frame over which natural climate oscillations can influence trends in global sea level.
Helping researchers separate natural variability and long-term change is one NOAA’s motivations for making its sea level data available to the public and researchers around the world. But scientists aren’t the only people who need accurate methods of measuring water levels, Bushnell adds. There are commercial applications, too, for shipping, shoreline development, and natural resource extraction. For example, as the Arctic thaws, ships will need more frequently updated data about water levels in the Northwest Passage, he says, which is “not an easy place to install gauges.”